

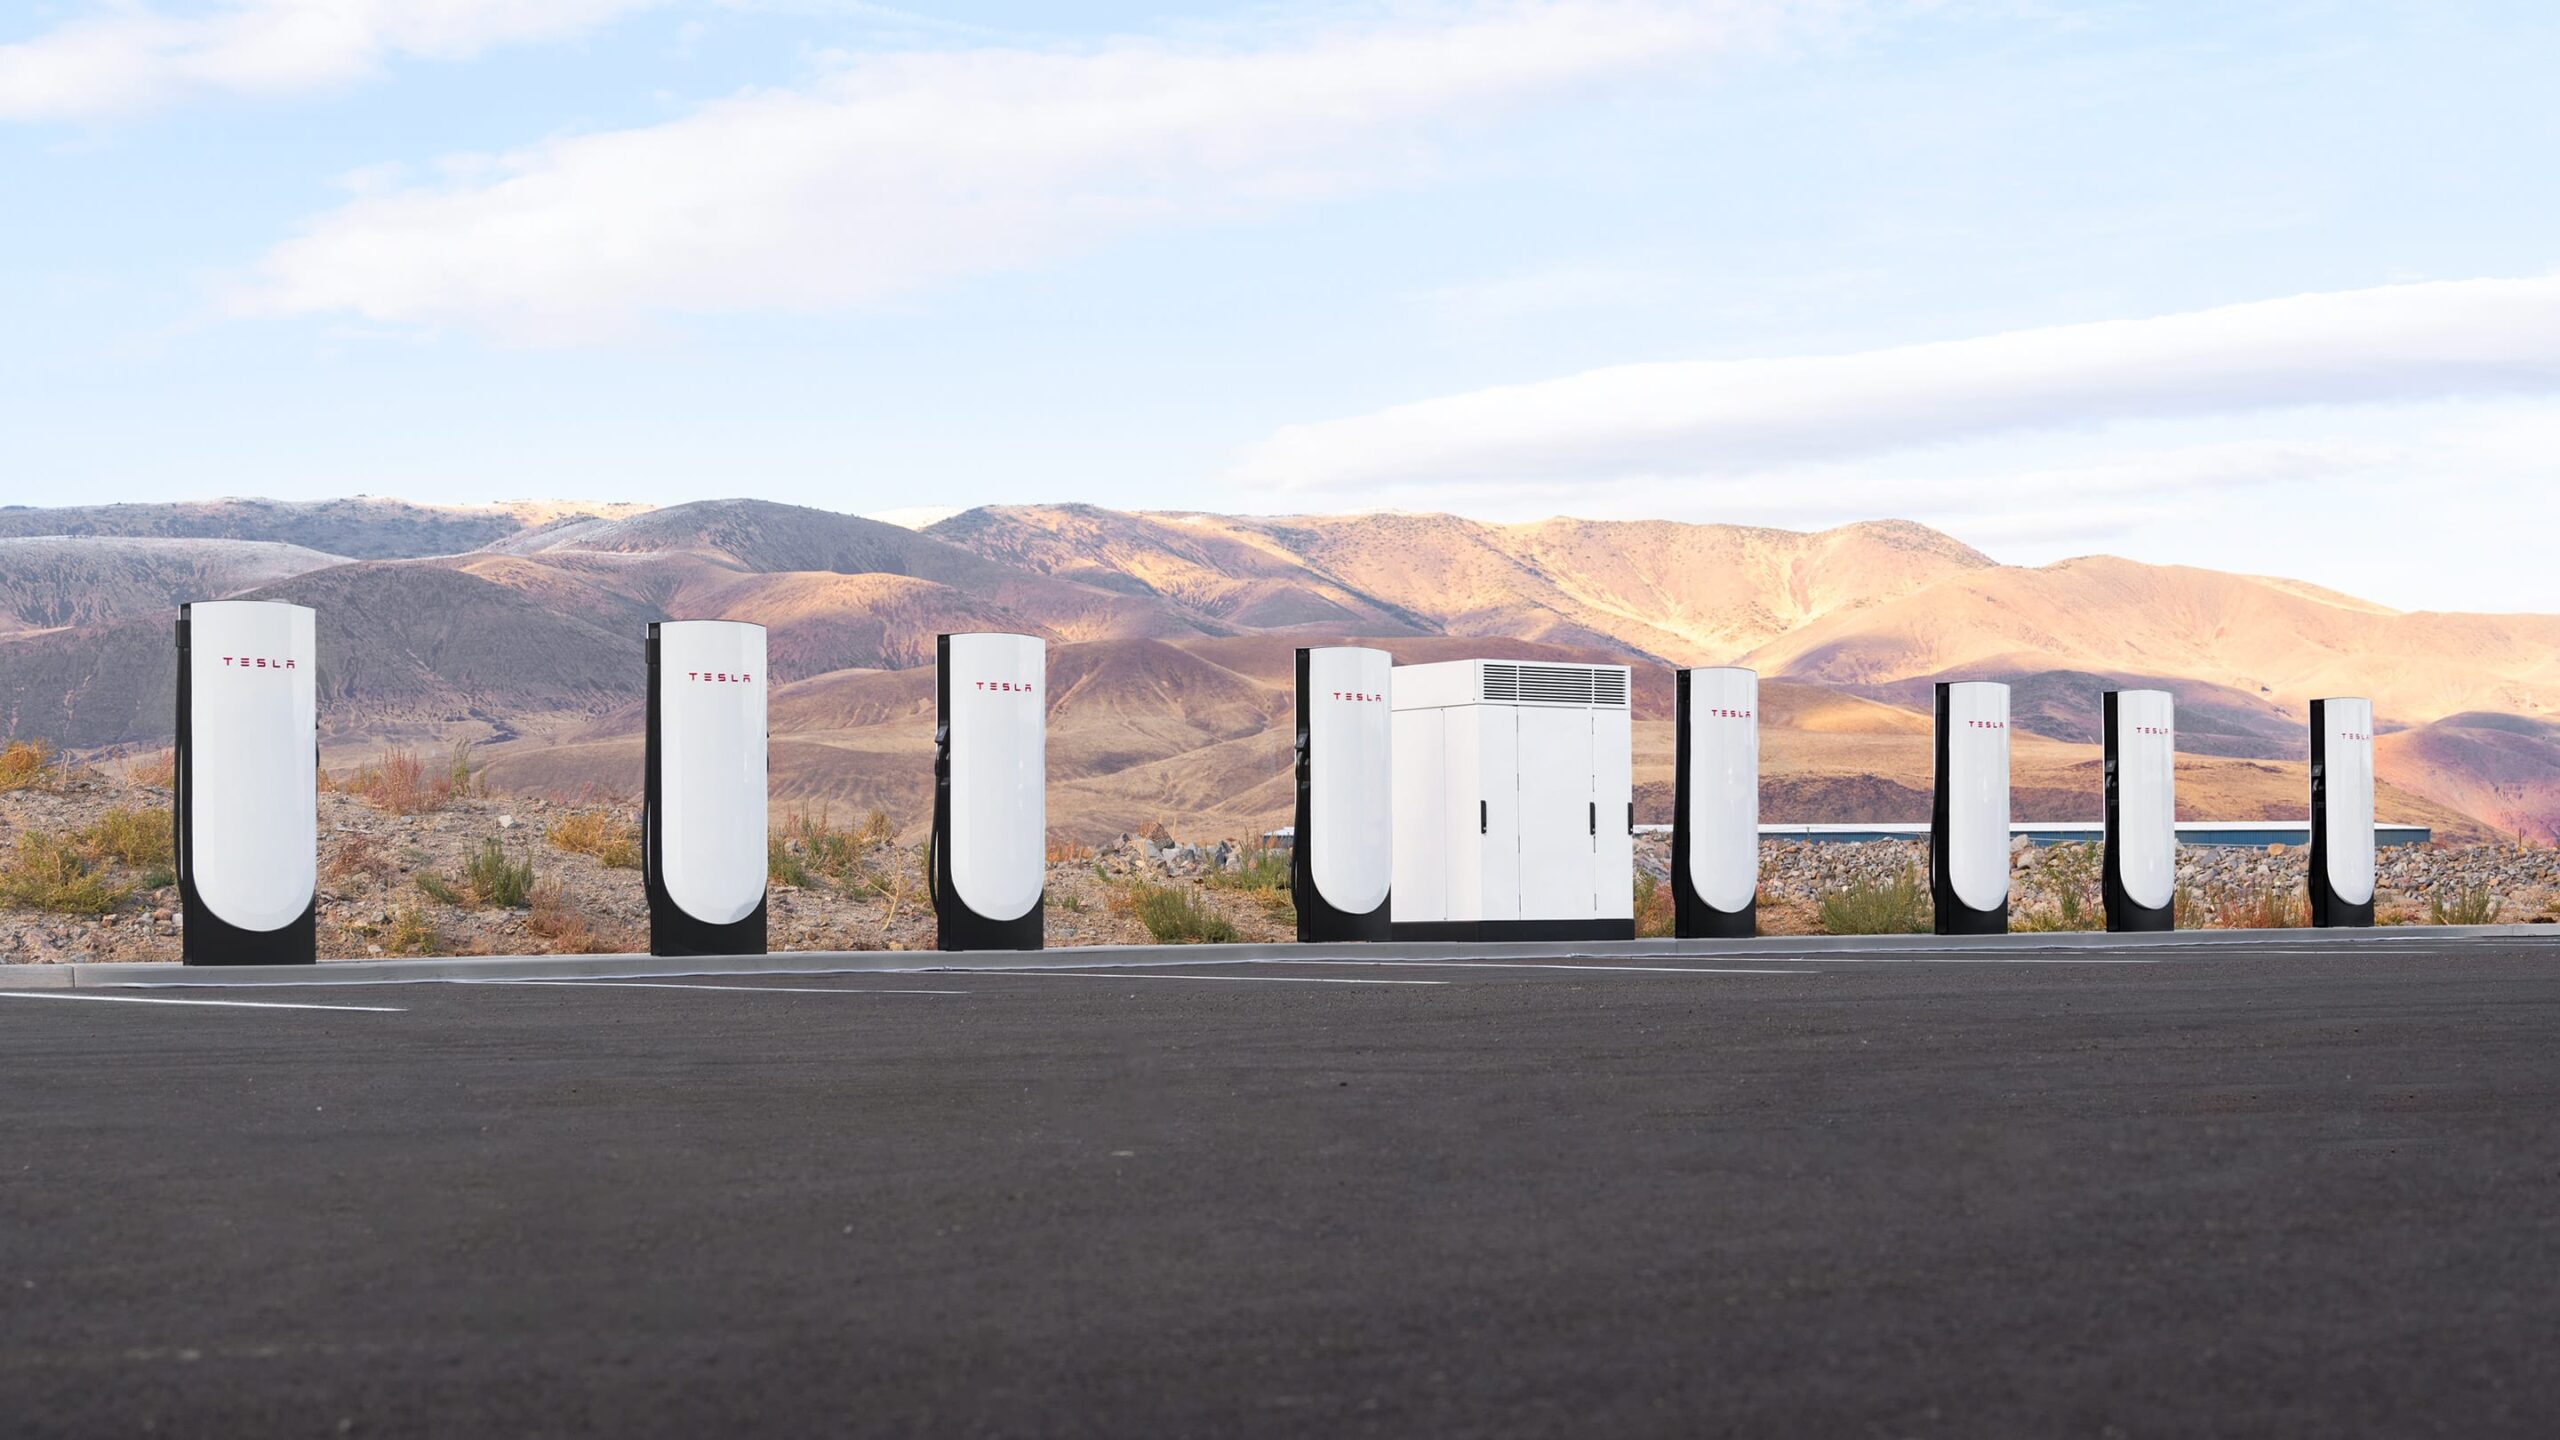
Tesla’s Supercharger network had reached 8,704 stations and 82,357 connectors by the end of the second quarter of 2026. These are the global figures Tesla published in its quarterly update on 22 July. The year-on-year comparison shows 18% growth in stations and 17% in connectors.
Archive coverage published on 23 October 2026. The editorial date of 23 July follows publication of the official figures; the content reconstructs that historical picture rather than presenting it as the network’s current size.
In this article
Tesla Superchargers: worldwide figures in June 2026
The table provides two snapshots of the network, at the end of the first and second quarters. It does not describe how many installations opened on a single day or represent a map of sites available in Italy.
| Measure | End of March 2026 | End of June 2026 |
|---|---|---|
| Stations | 8,463 | 8,704 |
| Connectors | 79,918 | 82,357 |
Source: Tesla Q2 2026 Update, Operational Summary table. The difference between the periods is 241 stations and 2,439 connectors. These are net changes in the reported totals, rather than a list of new construction sites or individual openings.
Stations and connectors: two different figures
A station is a charging location; connectors are the connection points counted within the network. Multiple connectors can be at the same site. Looking only at the station count therefore leaves out an important part of the picture.
A site with more charging points has a different configuration from a smaller one, even though both count as one station in the summary. The aggregate total, however, does not establish the size of each location. Nor does it describe how many cars are plugged in at a particular moment.
How to read Tesla Supercharger growth
The year-on-year comparison runs from June to June: the 18% and 17% Tesla reported are not growth solely over the preceding quarter. Mixing the two intervals would obscure the pace of expansion.
The quarterly difference answers another question: how much did the total change between March and June? Separating annual comparisons from quarterly changes helps avoid headlines attributing growth measured over twelve months to just three.
The table also measures overall network size. These values do not directly establish investment, revenue, average utilisation or waiting times. Those are different measures requiring dedicated data for the same period.
What it means for travel in Italy
A larger global network indicates its development, but does not prove that a station has opened near home or along a particular journey. Planning a stop requires checking the actual location rather than relying on the worldwide total.
Likewise, these figures do not specify every site’s power, prices or access conditions. They do not guarantee access for every electric vehicle. Those aspects must be checked for the chosen charging location and are not automatically shared by all counted connectors.
A historical snapshot, rather than a live counter
The timing is essential: the document was published in July and describes the situation at the end of June. A quarterly figure does not replace current operating information or indicate that all points are free at the same time.
For the vehicle picture in the same period, see our coverage of Tesla’s second-quarter 2026 deliveries. Charging infrastructure and vehicles are related activities, but their measures describe different things.
Primary source: Tesla Q2 2026 Update, published on 22 July 2026, presentation page 5, Operational Summary. Cover: archive image from Teslhub’s library.
Keep following news and analysis on Teslhub and our official Telegram channel.
Alessandro Marmaglio — Teslhub




Let’s discuss it
Experiences, questions and perspectives from the Teslhub community.
Please keep the discussion respectful. Members’ comments are moderated before publication.
Start the conversation. Leave the first comment.